Let us start with a non pivot table called Month Expenses with rows(A-E) and columns(1-6). The table being summarizing rows and columns.
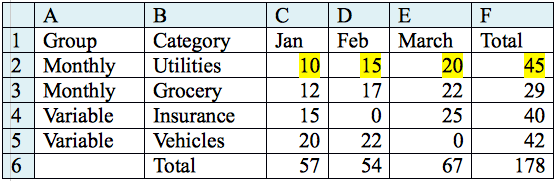
All totals are calculated by cell range summations. Utility total = sum of cells C2, D2 & E2 highlighted in yellow. (F2 = Excel function Sum(C2:E2) This table requires 7 summations(3 for the rows, 3 for the columns and 1 for the cross total). The cross totals(F6) for rows and columns should be equal. They are not. The Grocery total says 29. The total should be 51. Cell E3 was left out of the Grocery summation. Sum(C3:D3)
was accidentally entered. A pivot table avoids this mathematical error by doing all the summations. The pivot table, furthermore, can calculate all subtotals. The pivot table can show the Group Monthly sub total automatically. Why do the calculations manually when a pivot table can avoid any sub or cross total errors? Imagine a spreadsheet with non pivot tables containing hundreds of rows/columns and subtotals.
The other type of error that pivot tables avoid is inconsistent names. Let us change the above table categories to also have a column for specific companies. Even though a person would think of R.G.E and RG & E as logically the same company, separate rows for R.G.E and RG & E would exist in the table since the names are different. This situation is particularly troublesome when data is widely scattered over the spreadsheet. Example: Each month of the Month Expense table is on a separate sheet. Pivot tables force choosing one company name to get one total.
This consistent name feature brings up a powerful aspect of pivot tables. It has the capability to gather data together regardless of what row the data is in. See pivot table "Detail Data" below.
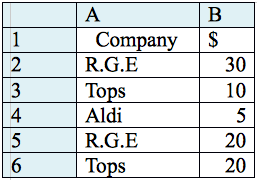
R.G.E.'s data is rows 2 and 5. The $ total = 50. The pivot table can find both R.G.E. rows and do the math. Although the function Sum can do the math, it can not isolate rows 3 and 4. The rows must be contiguous in its formula. In other words, Sum(B2:B5) can't do its calculation skipping B3 and B4. The function Lookup can find R.G.E. rows but can not get all the R.G.E. occurrences and do the math. Pivot tables can get all occurrences for each company and do the math as well and sort the results to obtain the following "Company $ Sum" pivot table.
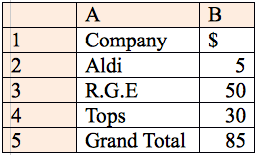
There isn't an Excel function can gather data, calculate the company totals, sort the results and automatically calculate row, column, sub and grand totals. Besides summations, pivot tables are capable of automatically calculating percentages, running totals, differences and other mathematical functions by simply selecting them rather than entering a formula.
Let's look at a more complex table named "Yr-Mth Detail Data" table that includes year, month, category, company and $ columns.
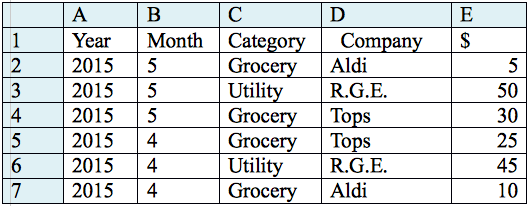
The following pivot table named "Expenses by Year Month" could be produced.
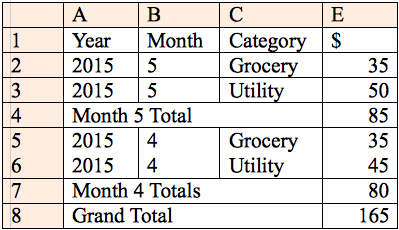
Imagine this table containing of thousands of rows and trying to do all the data gathering, math and sorting to get a summary table without a pivot table.
Another feature of pivot tables is allowing expansion and collapsing of columns or rows that are shown in the table like what Windows does with folders. The Category column could be collapsed so that only Month totals are shown. Excel has no function capable of doing this. Lastly any charts created from pivot tables are efficiently updated. The user just needs to enter the detail data and let the pivot table(s) do the rest by refreshing one of them. The assumption is that every pivot table points to the same detail data.
Pivot tables do have one requirement for all the above to happen. It is that the detail data must be in one cell range. Some of it can't be in let's say in cells P1 to R100 and the rest in X1 to Z100. In short, the data must follow database rules thereby avoiding both logical and mathematical errors.
If you would like to know more and a spreadsheet to track your household expenses for a budget contact Future Beacon or call Chuck at (585) 392-6258.